Dashboard

Overview
The data generated by companies in Cotalker can be assigned a value in an Administrative Panel. It's a simple way to manage and control the team with the visualization of specific metrics.
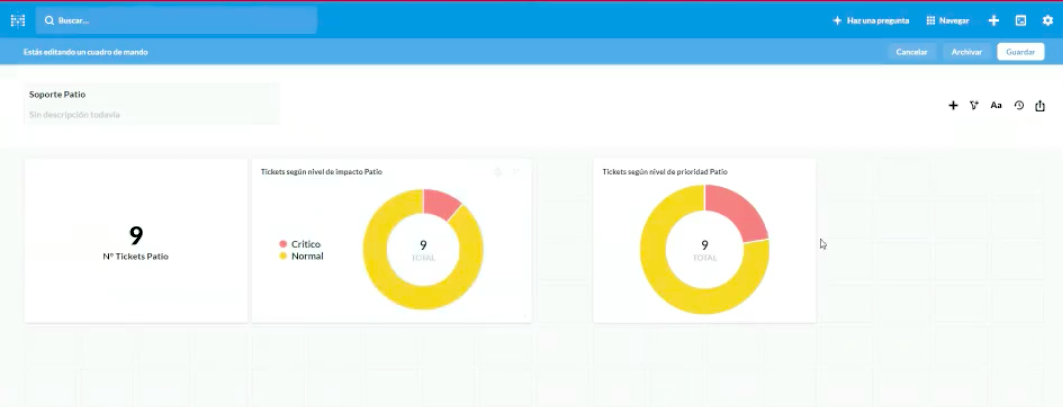
The dashboard looks like this:
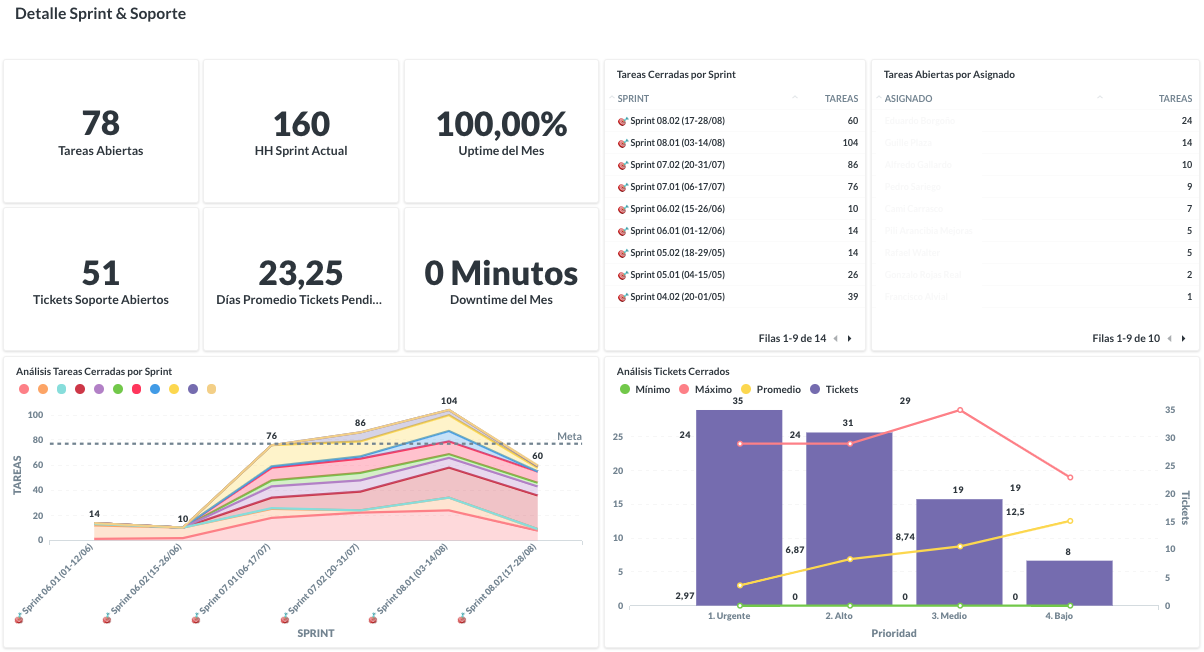
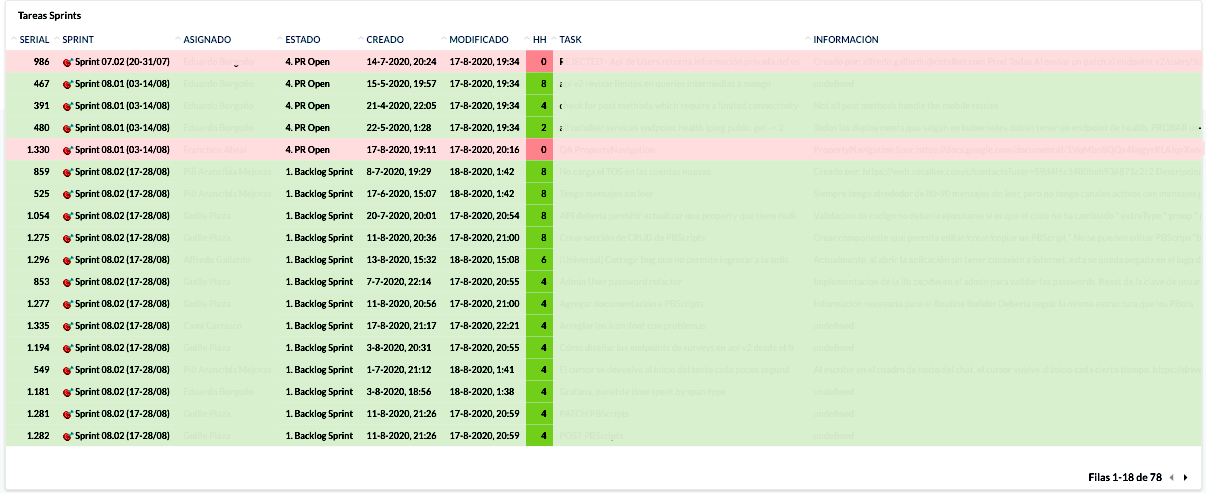
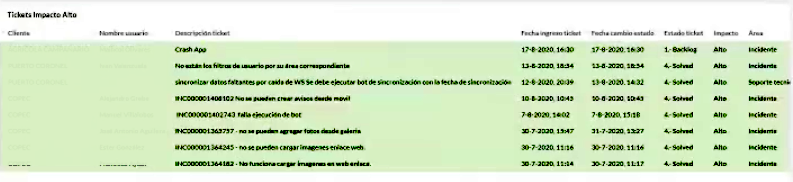
Names of the assignees and names and information of the tasks are hidden for privacy reasons.
We use Metabase to make the admin panel. It's an open-source Business Intelligence server that lets you ask questions about your data and displays answers in graphic formats that make sense, whether that's a bar graph or a detailed table.
Metabase
The dashboard is a set of questions that are shown in different formats. In the previous example, we can see eleven questions displayed.
All data access is stored in this section of the Metabase dashboard. It is grouped by company, and the name of each of the tables follows an internal format.
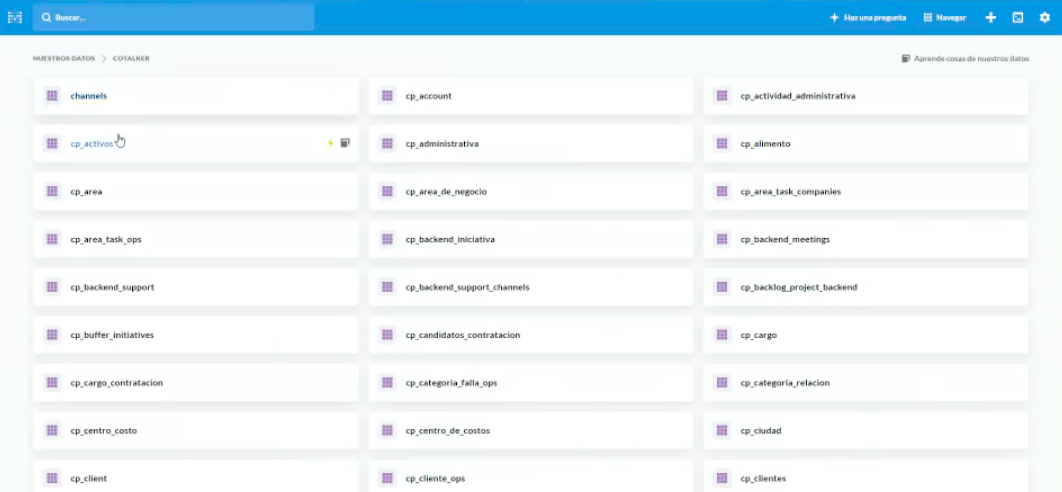
Check the BI section to know more about the tables.
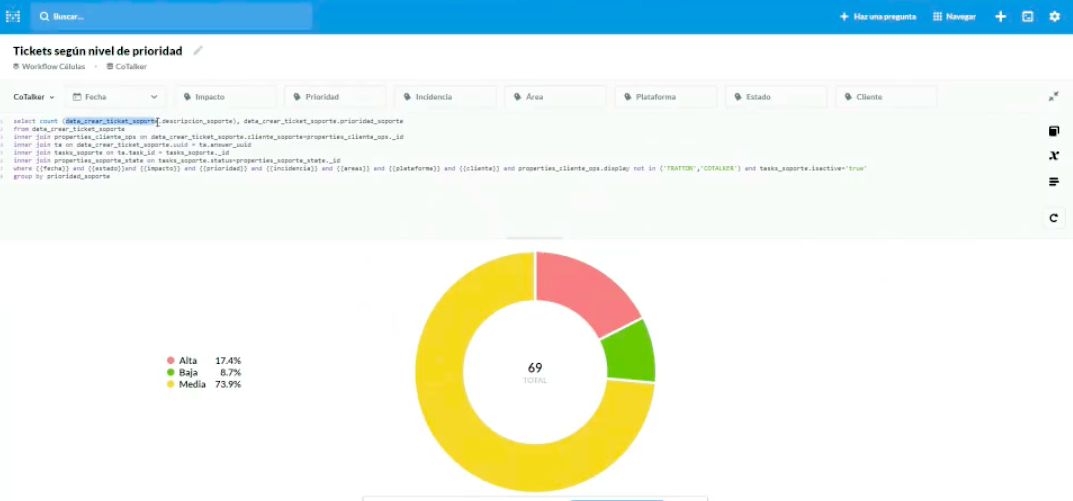
In this section, each of the questions are asked using SQL. With this language you can access the database tables shown above and get the information that needs to be displayed. Data can be:
- selected from tables
- grouped by any attribute
- filtered by any attribute
- and much more.
For example, get a company's closed tickets grouped by importance – with available filters of maximum, minimum, or average quantity.
Requesting a new implementation can sometimes be tricky.
Finally, when all the questions are ready, it only remains for you to add them to the dashboard. Cotalker will then display a link to this generated panel.
Check the Metabase documentation to know more about the configuration.
Limits of Metabase
- Display time: Because Metabase shows time with excess information, it is necessary to work the data so that it is shown in the following way:
- Knowledge in SQL: Familiarity with SQL is required to create dashboard questions.
- Dashboard table: It is only possible to make changes in the table columns; rows are established by default.
- Table operation: it's not possible to do some mathematical operations on a table. For example, in a table of open tickets, the total cannot be displayed in a row below.

It takes less time to make a dashboard with similar questions already created in another company since you only have to change the table's names and make some adaptations if necessary. But other times – when there are particular needs and Metabase limits are present – the implementation could take much longer.